FFT and Filter Visualization
Real-time spectrum analyzer with interactive audio filters.
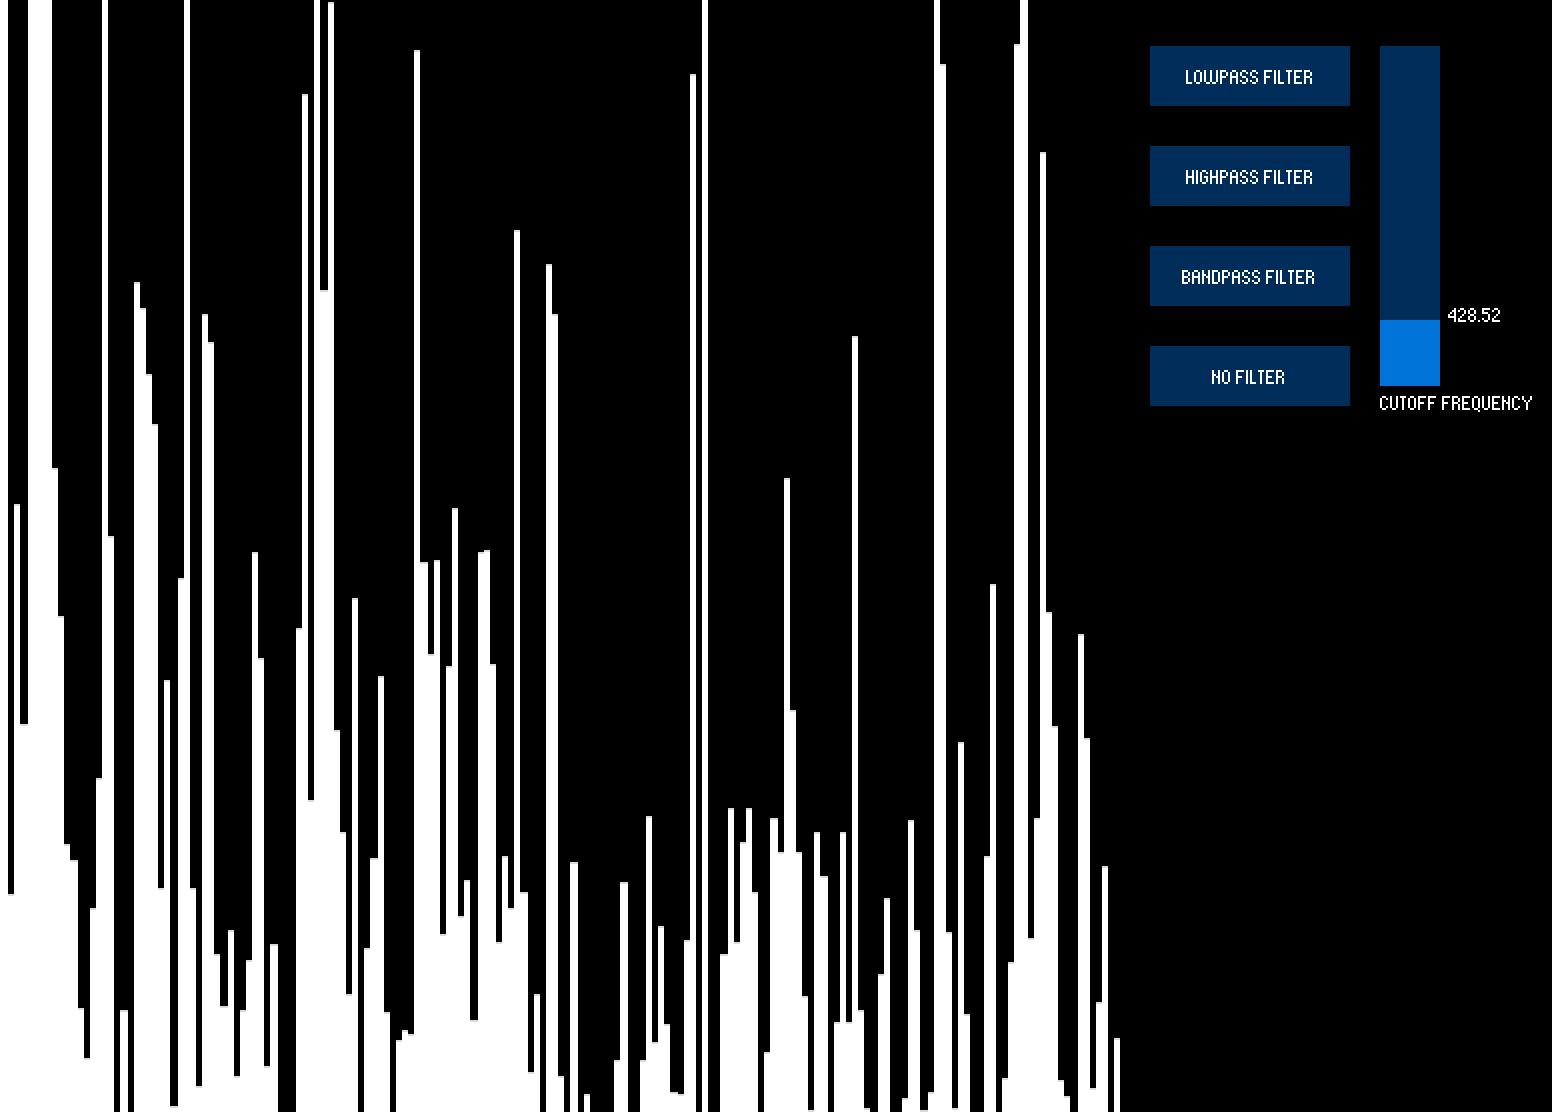
FFT and Filter Visualization is a program that uses the Beads audio library to display a real-time audio spectrum, allowing users to interactively apply and adjust low-pass, high-pass, and band-pass filters via a GUI built with ControlP5. The program loops an audio sample and visualizes its frequency spectrum in real time using FFT (Fast Fourier Transform), dividing the sound into 512 frequency bands and displaying each band's energy as a bar graph.
Users can switch filter types with buttons and adjust the cutoff frequency with a slider, immediately seeing the effect on the spectrum display. The filters are implemented using BiquadFilter, and the program functions as a real-time spectrum analyzer, visually demonstrating how each filter alters the sound's frequency components as the music plays. This project serves as both an educational tool for understanding digital signal processing concepts and a practical demonstration of how different filter types affect audio content in the frequency domain.